Goodbye, Anecdotes! The Age Of Big Data Demands Real Criticism
by Trevor Butterworth

If you think of all the information encoded in the universe from your genome to the furthest star, from the information that’s already there, codified or un-codified, to the information pregnant in every interaction, “big” has become the measure of data. And our capacity to produce and collect Big Data in the digital age is very big indeed. Every day, we produce 2.5 exabytes of information, the analysis of which will, supposedly, make us healthier, wiser, and above all, wealthier — although it’s all a bit fuzzy as to what, exactly, we’re supposed to do with 2.5 exabytes of data — or how we’re supposed to do whatever it is that we’re supposed to do with it, given that Big Data requires a lot more than a shiny MacBook Pro to run any kind of analysis. “Start small,” is the paradoxical advice from Bill Franks, author of Taming the Big Data Tidal Wave.
If you are a company that makes sense; but if Big Data is the new big thing, can it answer any big questions about the way we live? Can it produce big insights? Will it begat Big Liberty, Big Equality or Big Fraternity — Big Happiness? Are we on the cusp of aggregating utilitarianism into new tyrannies of scale? Is there a threshold where Big Pushpin is incontrovertibly better than small poetry, because the numbers are so big, they leave interpretation behind and acquire their own agency, as the digital age’s answer to Friedrich Nietzsche — Chris Anderson — suggested in his “Twilight of the Idols” Big Data manifesto from four years ago. These are critical — one might say, “Big Critical — questions. Is Lena Dunham the voice of her generation as every news story about her HBO show “Girls” seems to stipulate or is this just a statistical artifact within an aggregated narrative about women that’s even harder to swallow?
But because we are all disciples of enumeration, the first question is how big is Big? Well, an exabyte is a very big number indeed: one quintillion bytes — which is not as big as the exotically large quantities at the highest reaches of number crunching, numbers which begin to exhaust meaningful language like yottabytes;* but it’s getting there. If you were to count from one to a quintillion, and took a second to visualize each number (audibly counting would take a lot longer), your journey would last 31.7 billion years, and you’d still be less than halfway through a day in the digital life of the world. Or, imagine if each byte occupied a millimeter of visual space: every four days our modern Bayeux tapestry would cover a light year. By way of contrast, Claude E. Shannon — the “father of information theory” — estimated the size of the Library of Congress in 1949 at 12,500 mega bytes, which is by today’s standards, a mere Post-it note of information in the virtual annals of human data, albeit a rather useful one.
This latter historical tidbit (tidbyte?) comes from a thrilling, vertiginous essay by Martin Hilbert — “How much information is there in the ‘information society?’” — that appeared in the August 2012 edition of Significance, the Journal of the Royal Statistical Society, (one of the indispensable publications of the digital age). Hilbert has lots of interesting data and, a fortiori, lots of interesting things to say; but one of his most interesting observations is that the big bang of digital data resulted in a massive expansion of text within the universe, and not as you might have intuited, light years worth of YouTube videos, BitTorrent copyright violations, cat pictures and porn:
In the early 1990s, video represented more than 80% of the world’s information stock (mainly stored in analogue VHS cassettes) and audio almost 15% (on audio cassettes and vinyl records). By 2007, the share of video in the world’s storage devices had decreased to 60% and the share of audio to merely 5%, while text increased from less than 1% to a staggering 20% (boosted by the vast amounts of alphanumerical content on internet servers, hard disks and databases.) The multimedia age actually turns out to be an alphanumeric text age, which is good news if you want to make life easy for search engines.
The bathos is forgivable — after all, what else do we spend a vast amount of our time doing other than searching on the Internet for information? But, happily, such “good news” amounts to more than better functionality, a “gosh, how convenient!” instrumental break in the pursuit of better instrumentalism; it also means we can ask bigger questions of Big Data. We can ask what the big picture actually means, and — no less important — we can criticize those who claim to know. We can, in other words, be “Big Critics”; we can do “Big Crit.”
***
Big Crit got a big break in 2012, after a group of researchers at Bristol University’s Intelligent Systems Laboratory teamed up with a couple of professors from Cardiff University’s School of Journalism, Media and Cultural studies. They began with a straightforward, but non-trivial question: how much gender bias is there in the news media — as suggested by the gender ratios of men to women as sources in stories? The key to understanding why the path to answering this question is as important as the answer itself lies in asking, how much information and of what kind would you need to conclude that yes, the media is biased or not?
Pre-Big Crit, you might have had pundits setting the air on fire with a mixture of anecdote and data; or a thoughtful article in The Atlantic or The Economist or Slate, reflecting a mixture of anecdote, academic observation and maybe a survey or two; or, if you were lucky, a content analysis of the media which looked for gender bias in several hundred or even several thousand news stories, and took a lot of time, effort, and money to undertake, and which — providing its methodology is good and its sample representative — might be able to give us a best possible answer within the bounds of human effort and timeliness.
The Bristol-Cardiff team, on the other hand, looked at 2,490,429 stories from 498 English language publications over 10 months in 2010. Not literally looked at — that would have taken them, cumulatively, 9.47 years, assuming they could have read and calculated the gender ratios for each story in just two minutes; instead, after ten months assembling the database, answering this question took about two hours. And yes, the media is testosterone fueled, with men dominating as subjects and sources in practically every topic analyzed from sports to science, politics to even reports about the weather. The closest women get to an equal narrative footing with men is — surprise — fashion. Closest. The malestream media couldn’t even grant women tokenistic majority status in fashion reporting. If HBO were to do a sitcom about the voices of this generation that reflected just who had the power to speak, it would, after aggregation, be called “Boys.”
The closest women get to an equal narrative footing with men is — surprise — fashion. Closest.
But leaving that rather dismal quantitation aside, look at the study’s parameters. This kind of analysis doesn’t just end arguments it buries them and salts the earth — unless you are prepared to raise the stakes with your own Big Data-mining operation. Either way, we’ve dispensed with what you or I think of the media — and the fact that everyone who consumes media gets to be a “media critic” — and empowered a kind of evidence-based discussion. Think about all the pointlessness that can be taken out of arguments about political bias in the media if you can, in real time, dissect and aggregate all the media coverage at any given moment on any question. In the possibility of providing big answers, Big Crit frees us to move the argument forward. If the data is so decisive on gender bias, we now have a rational obligation to ask why is that the case and what might be done about it.
This is why — as interesting as their finding on gender bias is — the key point of the recently published Bristol-Cardiff study, “Research Methods in the Age of Digital Journalism” (pdf) is the methodology. “They programmed a computer to ask simple questions of a vast amount of material and it came up with the same results as human coders would have, “ says Robert Lichter, Professor of Communications at George Mason University in Virginia, and a pioneer in media content analysis (and for whom I worked on several content analyses). “This is a huge breakthrough, and one we’ve all been waiting for because nobody could capture digital media with hand coding.” In terms of seeing the big picture in the exponentially expanding digital mediaverse, it’s like being able to go from Galileo’s telescope to the Hubble. We didn’t have a way of seeing the contents of the whole media system, says the lead author of the study, Nello Cristianni, Professor of Artificial Intelligence at Bristol University, because its vastness meant it could only be seen by automated methods. Now, we have the technology.
***
Being able to see the media mediate in real time is a pretty big development in the annals of Big Data, yet surprisingly, or unsurprisingly, the media didn’t quite grasp why this was a big story. Such coverage as there was — Wired UK — focused on the surface of the study, what it found but not how it found it. Only Gigaom’s Derrick Harris seemed to understand the implications of the analytical breakthrough: “The experiment’s techniques actually point to a future where researchers are spared the grunt work of poring through thousands of pages of news or watching hundreds of hours of programming, and can actually focus their energy of explaining.”
In the not-so-distant past, when nations were kept informed by a handful of news organizations, figuring out how “the media” framed issues for public consumption was a laborious task for political scientists. Teams of trained coders would spend months — in some cases, years — going line-by-line through hundreds of stories and transcripts to draw out the patterns and calculate, using statistical software, what it all might have added up to. As a one-time content analysis serf in this hugely tedious process, explaining that I assigned hundreds of different codes to the different kinds of information embedded sentence-by-sentence in a news story seemed to invite both mockery and pity. It seemed counter intuitive that turning words into numbers could tell us anything really meaningful about the role of the media, how it shaped society, or even what a story really said.
Yet the results of simple, pre-Big Data aggregation were often eye opening. Who knew, for example, that military force was advocated ten times as often as diplomacy in television coverage of foreign news by the US media after 9/11 — and even after the ostensible defeat of the Taliban? Who knew that the US was urged to act unilaterally three times as often as with its allies? And were these trivial findings when set against public opinion surveys which showed that people who got their news from TV were more likely to support the War on Terror, or believe that Saddam Hussein possessed weapons of mass destruction? Unfortunately, we only saw these patterns after they had happened.
Perhaps one of the most startling and effective deployments of content analysis in recent years came through the research of Elvin Lim, and were published in his 2008 book, The Anti-Intellectual Presidency. Lim, now a political scientist at Wesleyan University, analyzed the content and complexity of annual presidential addresses and inaugural speeches to show how political rhetoric had devolved since the 18th century beyond the kind of simplification and clarity one might expect as speech — and society — evolved.
By marrying computational to historical and political analysis (Lim, for instance, interviewed every living presidential speechwriter to elucidate and give context to his data), he showed that at a certain point simplification began to have an effect on the substantive content of political speech, so that (to somewhat oversimplify his findings) FDR was not simply a better rhetorician than say, Bill Clinton, or both Bushes, he was more substantive, in part, because he used language in a more stylistically complex way, and believed that presidential speech should be pedagogical. What happened over the last 50 years, said Lim, was that presidents and speechwriters deliberately abandoned oratory and embraced an anti-intellectual style. The result is demagoguery. It’s an utterly fascinating, compelling, book that absolves neither party from their sins against language. And it’s jammed with data.
Though Cristianini and his team didn’t deploy the level of analysis Lim did to presidential speech, they did a general test for news media readability using Flesch scores, which assess the complexity of writing based on the length of words and sentences. Shorter, on this account, means simpler, although that doesn’t mean that shortness of prose breadth always denotes simplicity; for general purposes, Flesch scores tend to hit the mark: writing specifically aimed at children tends to have a higher score over, say, scholarship in the humanities, and these differences in readability tend to reflect differences in substantive content.
According to Cristianini et al.’s analysis of a subset of the media — eight leading newspapers from the US and seven from the UK; a total of 218,302 stories — The Guardian is considerably more complex a read than any of the other major publications, including The New York Times. Surprisingly, so is the Daily Mail, whose formula of “celebrity ‘X’ is” happy/sad/disheveled/flirty/fat/pregnant/glowing/ and so on apparently belies its complexity (when I mentioned this to a friend who is an intellectual historian and Guardian reader, she said, “actually, sometimes I do read the Mail”). Together, according to Comscore, these three publications are the most read news sources in the world.
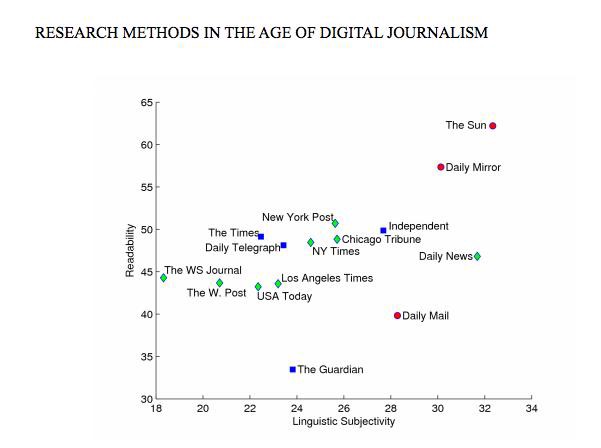
Comparison of a selection of US and UK outlets based on their writing style.
From the study Research Methods In The Age Of Digital Journalism (used with permission).
Cristianini et al. also measured the percentage of adjectives expressing judgments, such as “terrible” and “wonderful” in order to assess the publication’s degree of linguistic subjectivity. Not surprisingly, tabloid newspapers tended to be more subjective, while the Wall Street Journal, perhaps owing to its focus on business and finance, was the most linguistically objective. Despite The Guardian and the Daily Mail’s seemingly complex prose, the researchers found that, in general, readability and subjectivity tended to go hand-in-hand when they combined the most popular stories with writing styles. “While we cannot be sure about the causal factors at work here,” they write, “our findings suggest the possibility, at least, that the language of hard news and dry factual reporting is as much as a deterrent to readers and viewers as the content.” When political reporting was ‘Flesched’ out, so to speak, it was the most complex genre of news to read, and one of the least subjective.
When I asked Lim what he thought of the study via email, this, he said, was the pattern that stood out. “This means that at least in terms of the items included in the dataset, the media is opinionated and subjective at the same time that it is rendering these judgments in simplistic, unsubtle terms. This is not an encouraging pattern in journalistic conventions, especially given that the public appears to endorse it (given the correlation between the popularity of a story, its readability, and subjectivity).”
Even more provocative, when Cristianini et al. looked at the market demographics for the UK publications, they found “no significant correlation between writing style and topics, or between topics and demographics in respect to outlets. Thus, it appears, audiences relate more to writing style than to choice of topic — an interesting finding since prevailing assumptions tend to assume readers respond to both.”
“This means that at least in terms of the items included in the dataset, the media is opinionated and subjective at the same time that it is rendering these judgments in simplistic, unsubtle terms.”
That all this data mining points to the importance of style is just one of the delightful ways that Big Crit can challenge our assumptions about the way markets and consumers and the world works. Of course, we are still, in analytical terms, learning to scrawl. As Colleen Cotter — perhaps the only person to have switched from journalism to linguistics and to then have produced a deep linguistic study of the language of news — cautions, we need to be careful about reading too much into “readability.”
“If ‘readability,’ is just a quantitative measure, like length of words or structure of sentences (ones without clauses),” she says via email, “then it’s a somewhat artificial way of ‘counting.’ It doesn’t take into account familiarity, or native or intuitive or colloquial understandings of words, phrases, and narrative structures (like news stories or recipes or shopping lists or country-western lyrics).” Nor do readability formulas take into account “the specialist or local audience,” says Cotter, who is a Reader in Media Linguistics at Queen Mary University in London. “I remember wondering why we had to have bridge scores published in the Redding, CA, paper, or why we had to call grieving family members, and the managing editor’s claims that people expect that.”
There are other limits to algorithmic content analysis too, as Lichter notes. “A content analysis of Animal Farm can tell you what Animal Farm says about animals,” he says. “But it can’t tell you what it says about Stalinism.”
And that’s why we are still going to need to be smart about how we use Big Crit to interrogate Big Data: a computer cannot discern by itself whether the phrase “Kim Jong-Un is the sexiest man alive,” is satire or a revealing statement of cultural preferences. Problems like this scale up through bigger and bigger datasets: we are on the path to solving problems that can only be seen when a million data points bloom, while, simultaneously, confronting statistical anomalies that rise, seductively, like Himalayas of beans, from asking too many data points too many questions.
But the possibility of Big Crit restores some balance to the universe; we are not simply objects of surveillance, or particles moving in a digital Big Bang, we have the tools to look back, and see where we are at any given moment amid exabytes of data. Changing starts with seeing — and it starts with being able to see how shaping the world as it is being shaped in a deluge of information. But it’s hard not to think that there isn’t more to all this than just media criticism about the news. Take an imminent development, the end of the common page view as a worthwhile measure of human engagement with online media. The data produced by you reading this page will soon evolve into a genome of your online self, which will be followed and analyzed as you flit from screen to screen, and used to predict your behavior and, of course, sell products.
The hidden meta-narratives starring the virtual you don’t just demand criticism because they involve new forms of hidden power (and because all power is encoded with assumptions about what philosophers call “the good”), they renew criticism by revitalizing the notion of critical authority. We can, in fact, say very definite things about the textual and numerical nature of the digiverse because we’ve stepped back into modernity through a new kind of technological flourishing; and, as with our previous adventures in modernism, it’s a place where the critic is indispensable.
* Dear mathematics, please get around to coining “alottabytes;” you know you want to and it would make everybody chuckle when they wrote it. It would also make up for missing the opportunity to enumerate a “gazillion.”
Trevor Butterworth is a contributor to Newsweek and editor-at-large for STATS.org. Image by winui, via Shutterstock.