That Big Study About How the Student Debt Nightmare Is in Your Head? It's Garbage
The worries are exaggerated: Only 7% of young adults with student debt have $50,000 or more. http://t.co/Aavawc8KpC
— David Leonhardt (@DLeonhardt) June 24, 2014
Doesn’t that sound like a fact? Well, it’s something that might be a fact.
The Brookings Institute Institution (!!!) is here to tell you that the whole fable of debt-panicked young people in America is a lie! And their study comes complete with a huge announcement in the New York Times, which puts a rather snide slant on the whole thing. It’s all in your head, millennials! “Only 7 percent of young-adult households with education debt have $50,000 or more of it,” summarizes the Times up top. (There’s a quiet and enormous caveat in that sentence, which we’ll get to shortly!)
But then they must backtrack from this tale a bit:
The first thing to acknowledge is that student debt has risen over the last two decades. In 2010, 36 percent of households with people between the ages of 20 and 40 had education debt, up from 14 percent in 1989. The median amount of debt — among those with debt — more than doubled, to $8,500 from $3,517, after adjusting for inflation.
So let’s see: people with college debt saw their debt double, and also the number of those households with debt more than doubled. That is not exactly undermining this supposedly fake narrative of the increase of student debt! What’s more, the Times notes, tuition and fees at public colleges are up 50% in the last ten years.
Then they must come to this graph.
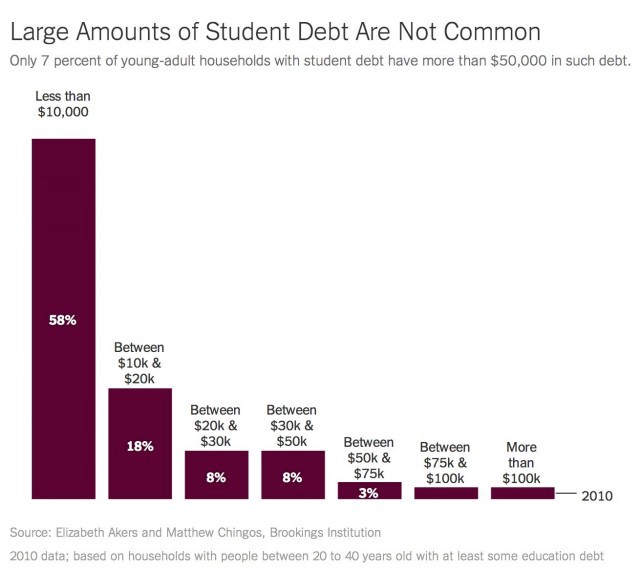
Do you see where that says “based on households with people between 20 to 40 years old with at least some education debt”? That’s actually quite a bit of a fudge!
What’s the deal with these numbers? GLAD YOU ASKED. It’s not what it sounds like!
• Those aren’t households with people between 20 and 40; those are households headed by people between 20 and 40. Which is to say, this data excludes all people living in households headed by, say, their parents, or other adults. The way Brookings put this is: “households led by adults between the ages of 20 and 40.” Just another way to say it excludes all households led by anyone over 40! (Those households might be identical in student debt to “young” households! Or they might not? WHO KNOWS!)
• One effect of this age spread sample is that it includes college graduates from up to almost 20 years ago. This is literally not at all a study of college graduates of the last five years, or even ten years. We’re talking about people up to the age of 40, well into Gen X.
• Also, in this survey, when there are multiple people in the household, the Brookings Institution simply divided the amount of college debt by number of people in the household. So one person’s $20,000 college debt becomes two people’s $10,000 college debt. This works out mathematically, of course, but not structurally.
• And finally: The number of the people making up this data is quite small.
Where does it come from? GLAD YOU ASKED.
All this data comes from the Survey of Consumer Finances, which is conducted by the Federal Reserve Board of Governors and the Department of Treasury. It takes place every three years, since 1983. It samples about 4500 households in the U.S., usually, but recently expanded to 6500 households. And this isn’t new data; this is the data from their 2010 survey. (The 2013 survey will be published in 2015.)
Of all the households in that study, only about 1711 have “household heads” that are younger than 40. That’s what they’re extrapolating from. (And, intriguingly, a small number of those have a head of household younger than 18.) This is not a big sample!
What, obviously, does this data completely omit? Well, one obvious thing is… households who are headed by someone who is not under 40. One thing we know is that, in 2012, 36% of Americans aged 18 to 31 were not their head of household, because they were living with their families.
This survey also clearly combines family and non-family households. (Also, there’s some unknown amount of statistical imbalance from same-sex households; 31% of same-sex households are likely to have two college-degreed people, compared to 24% of opposite-sex married households and just 12% of opposite-sex cohabitating households.)
And finally… this survey is, essentially, of rich people. No, literally!
We apply survey weights throughout the analysis so that the results are representative of the U.S.
population of households. The use of survey weights is particularly important in the SCF because
the sample design oversamples high-income households to properly measure the full distribution of
wealth and assets in the United States. This high-income sample makes up approximately 25 percent of
households in the SCF.
Literally what they are saying there is that the information on which they are basing a sweeping assessment of American student loan debt is based on a sample in which 25% of those surveyed were “high-income households.” This is insane. (Update: I wanted to clarify that I get it that they are weighting this over-representation down to represent the population at large; that’s not my beef, entirely. Mostly I think it shows a further weakness in their non-rich sample at large.)
Here’s a fun footnote in the actual Brookings Institution report:
These statistics are based on households that had education debt, annual wage income of at least $1,000,
and that were making positive monthly payments on student loans. Between 24 and 36 percent of
borrowers with wage income of at least $1,000 were not making positive monthly payments, likely due
to use of deferment and forbearance….
So… they… set aside as much as 1/3rd of people in the survey sample because they weren’t paying off their student debt. That’s an intriguing class of debtors, don’t you think? They claim that dismissing these people from the sample did not “qualitatively alter the pattern of results reported above”; so why dismiss them at all?
It’s shocking that the Times presents this survey in this way. This study does actually tell us things! It’s not actually a pack of lies. It just doesn’t tell us necessarily what people are saying it’s telling us. And no one of course will actually read the whole survey, so its repackaging will now enter the narrative, thanks to bloggers….
Great @dleonhardt piece on research by @chingos and @bethakersed suggesting the sky isn’t falling on student debt http://t.co/R7eOuCQJPY
— Dylan Matthews (@dylanmatt) June 24, 2014
The new DC parlor game: Find some random economic or social shift. Blame it on student loan debt. Ignore data. Repeat yourself. Meme started
— Justin Wolfers (@JustinWolfers) June 24, 2014
… and professional policy wonks alike. And that’s a huge disservice.
UPDATE
I wanted to specifically call attention to this criticism at Quartz, which actually… doesn’t really disagree with anything either here or in the report. It’s full of good points, but what it’s not is any kind of defense of either the Brookings Institution study or of the marketing of that study. Saying that it’s a small-ish percentage of debt-havers that are carrying massive amounts of debt isn’t controversial or unreasonable. It’s actually probable! But presenting a definitive landscape of America’s student debt based on heavily sampled data most recently updated in 2010 and heavily weighted to “reflect” America as a whole is lot less useful. (Have we not been through this on a daily basis with the Huffington Post Science section, after all?)