Understanding the Commercial Real Estate Crisis

Earlier, we mentioned today’s Congressional Oversight Panel’s report on what they call “a commercial real estate crisis on the horizon.” The horizon, it turns out, is rather near! So, let’s back this up. Commercial real estate loans usually have a rather short term of between three and ten years, and there is often a large final payment at the end of that term-a payment which is almost always covered by an additional loan. The panel is explaining, rather obviously, both that loan default rates are already high and that additional lending is difficult to secure, and so a rather high rate of default on these much larger payments should certainly be expected. Over the next four years, $1.4 trillion in loans will hit the end of their terms. Half of those loans are for property that is underwater. What’s more, a number of these loans come from banks that may be stretched a bit thin. Those are the basics, but let us look at some of the panel’s easy to understand graphs about the situation!

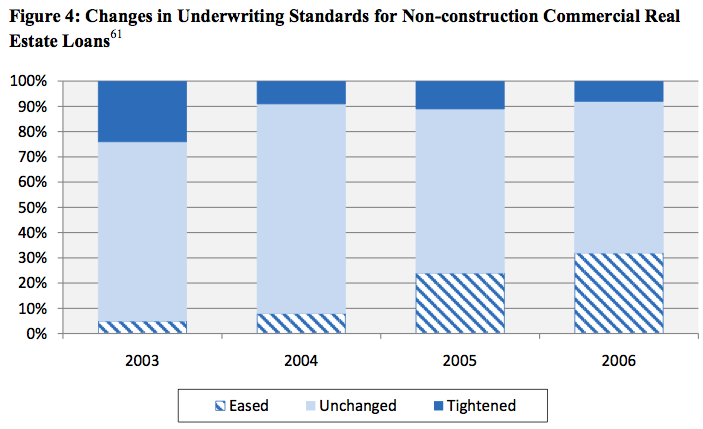
Because large institutions aggressively took over residential lending, smaller banks began to focus on commercial lending. But big banks still took the big customers, obviously, who could show easy income from other properties to secure loans. So, in short, the small banks were left with the riskier offerings. This graph categorizes loans made with what are politely called “lax” standards.
Meanwhile, the nature of commercial lending was changing. “In the late 1990s, only six to nine percent of the loans in commercial mortgage-backed securities [CMBS] transactions were interest-only loans, during the term of which the borrower was not responsible for paying down principal. By 2005, that figure had climbed to 48 percent, and by 2006, it was 59 percent.” Translation: three out of five of the CMBS loans in 2006 were not even engaged in paying down the loan; they were merely servicing the interest, a much smaller payment. Just ten years ago, nine out of ten CMBS commercial loans were actually having the money owed paid down.
The number of interest-only loans ratched down dramatically in 2008, but had a significant upswing in 2009.

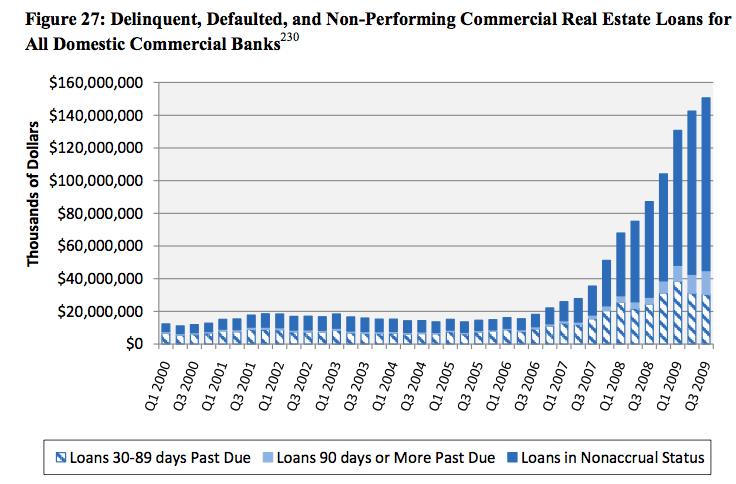
“Nonaccrual status” means a loan that is no longer collecting interest, most likely because it is beyond 90 days overdue. This graph pretty much speaks for itself!

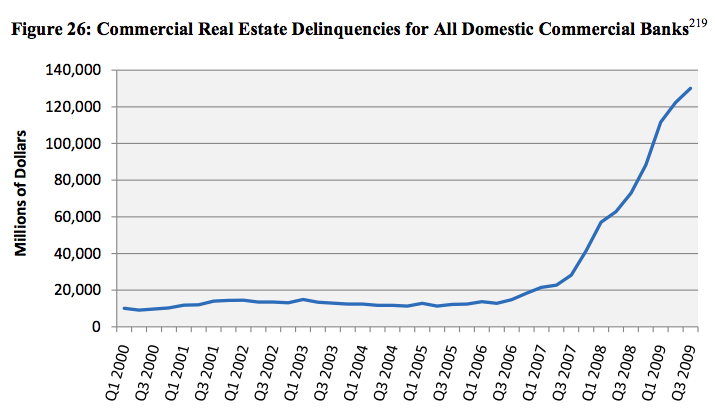
I would suggest that this graph speaks for itself fairly well also.

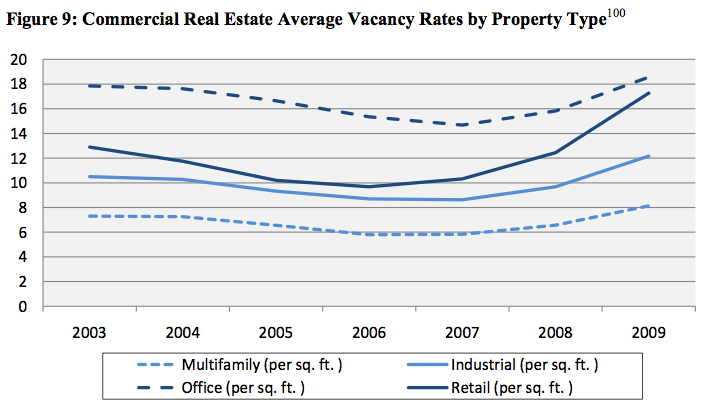
This graph explains some of the underpinning of loan default due to that old tradition of nonpayment, called “lack of income due to vacancy.” Of particular note is the strong recent upswing in retail vacancy.
Those are some of the basics. The entire report is largely readable by real humans, if you’d like to give it a whirl! (And don’t be scared of its 189 page length-there’s just a lot of footnotes and appendices and stuff. You know, facts and whatnot.)
