The 2009 GDP? It's the Worst Since 1946 -- And 7.6 Million Jobs Disappeared in Two Years
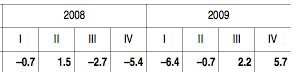
We’re going to talk about math and finance here, so take a deep breath. I’ll go slow for you! The big headline today is that, from 2009’s third quarter to the fourth quarter, the gross domestic product increased at an annualized rate of 5.7%. This sounds really big! So many big headlines about it. But may we put it in perspective? One of the short versions is that people had more cash, and spent more, in the final three months of the year, that they did in the previous three months. So when the Times trumpets that the “U.S. Economy Grew at Fastest Pace in 6 Years Last Quarter,” what they mean is that, in six whole years, this is the largest quarter over quarter contrast. Is this shocking? Actually it is because the previous quarter was kind of garbage. Let us instead compare to years previous. The government says: “GDP decreased 2.4 percent in 2009 (that is, from the 2008 annual level to the 2009 annual level), in contrast to an increase of 0.4 percent in 2008.” So, you know, another way to headline this announcement would be something like: “U.S. Economy Ended 2009 Only 2.4% Worse Than 2008.” Here’s how Bloomberg expressed that idea: “For all of 2009, the economy shrank 2.4 percent, the worst single-year performance since 1946.”
More than 200,000 (non-farm) jobs disappeared in the last quarter of 2009 alone. They haven’t announced the official 2009 job loss numbers yet, but we can estimate.
216,000 in August. 53,000 in September. 190,000 in October. And so December ended the year with an unchanged official unemployment rate of 10%, or 15.3 million people. Two years ago? We ended 2007 with 7.7 million officially unemployed people, with an unemployment rate of 5%.
So yes, math tells us that official unemployment double in two years. And that doesn’t count millions of people like yours truly, who are no longer employed but cannot collect unemployment.
You see, I think, how these ahistorical, quarter-over-quarter press releases that get trumpeted on the front pages in this fashion have actually no relation to the real numbers in any kind of actual context.
Here’s the absolutely most interesting part of today’s government release, from the very bottom. Let’s read it real slow, together!
Current-dollar GDP decreased 1.3 percent, or $182.7 billion, in 2009. Current-dollar GDP increased 2.6 percent, or $363.8 billion, in 2008.
During 2009 (that is, measured from the fourth quarter of 2008 to the fourth quarter 2009), real GDP increased 0.1 percent.
That means that the last quarter of 2009 was just a tiny, smidge bit better than the also-sad fourth quarter of 2008. And you know what this means? It means that year over year, in 2009 nothing good happened at all.
When you look at the real numbers, here’s what you have. (When they say “real,” they mean “measures as expressed as index numbers” with 2005, as a reference point, equal to 100.)
The Real Gross Domestic Product 2005: 100
The Real Gross Domestic Product 2007: 104.872
The Real Gross Domestic Product 2008: 105.331
The Real Gross Domestic Product 2009: 102.772